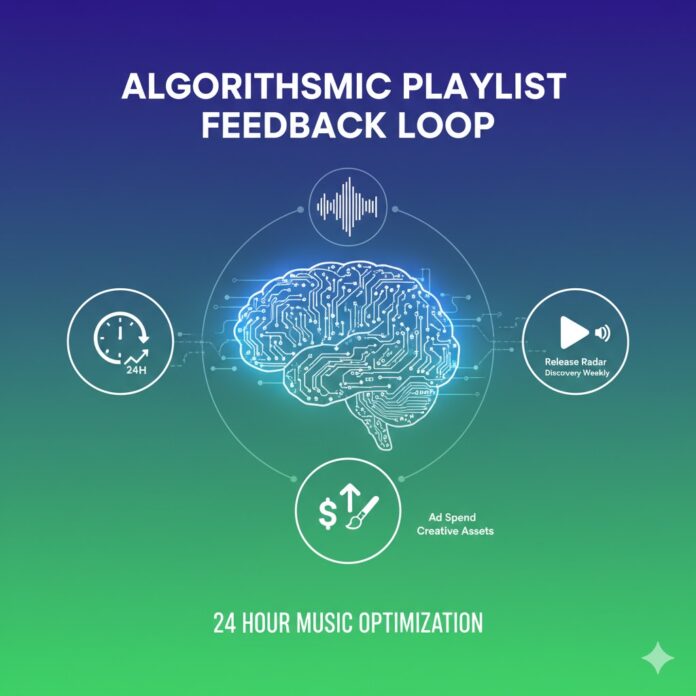
🎧 The Algorithmic Feedback Loop: Optimizing Your Music Release Strategy in the First 24 Hours
The moment your new track drops, the clock starts ticking. For independent artists and labels, the first 24 hours after a release are critical, not just for generating initial streams, but for influencing Spotify’s powerful editorial and algorithmic playlists: Release Radar and Discovery Weekly.
This isn’t a passive waiting game—it’s an opportunity for an Algorithmic Playlist Feedback Loop. By rapidly analyzing your track’s performance on these playlists, you can make informed, mid-campaign adjustments to your ad spend and creative assets, maximizing your momentum and lowering your overall cost per stream.
Here is a deep dive into how to analyze that crucial first day and what actions to take.
📈 Phase 1: Analyzing the First 24 Hours of Algorithmic Data
Your goal is to quickly determine if the right listeners are engaging with your music. Two key metrics from Spotify for Artists will provide this feedback:
1. Release Radar Performance (The “First Test”)
Release Radar (RR) is the immediate test. It places your music in front of your most dedicated followers and listeners who have streamed your similar music in the past.
| Key Metric | What It Tells You | Actionable Threshold |
| Streams from RR | Your initial reach and follower strength. | Look for a high volume, relative to your follower count. |
| Listener Save Rate | How many listeners added the track to their Library or a personal playlist. Crucial for Discovery Weekly eligibility. | Goal: >1.5% of RR listeners saving the track. Lower is a warning sign. |
| Listener Skip Rate | How many RR listeners decided the song wasn’t for them. | Goal: <30% skip rate. A higher skip rate signals a mismatch between your audience’s expectations and the song/cover art. |
2. Streams from “Other Listeners” and “External” (The “Discovery Test”)
While Discovery Weekly (DW) takes a few days to fully kick in, the initial activity from “Other Listeners” and “External” traffic (which includes listeners from your ads) will start to show conversion quality.
- Focus on Conversion: Are streams coming from ads/external sources converting into saves and playlist additions at a similar or better rate than your dedicated Release Radar audience?
- The Vibe Check: High streams but a low Save Rate (<1%) suggests your advertising is driving volume, but the audience you’re targeting doesn’t actually like the track enough for the algorithm to take notice.
🛠️ Phase 2: Activating the Feedback Loop & Mid-Campaign Adjustments
Based on your 24-hour data, you should have a clear picture of what the algorithm thinks of your track. This allows you to make precise, targeted adjustments to your active advertising campaigns.
Scenario A: High Streams, High Saves/Low Skips ✅
The Feedback: Spotify is confirming that the listeners you are attracting are high-quality and engaged. The algorithm is being fed positive signals.
| Mid-Campaign Adjustment | Rationale |
| Increase Ad Spend (Budget) | Scale what works. Aggressively increase the daily budget for the highest-performing ad sets (the ones driving the best conversion rates). You have hit a successful product/market/audience fit. |
| Duplicate and Expand Audiences | Create lookalike audiences or broader interest-based audiences, as the initial signal is strong enough to justify spending more on discovery. |
Scenario B: High Streams, Low Saves/High Skips ⚠️
The Feedback: Your advertising is working to drive traffic, but the quality of that traffic is low. The listeners are quickly deciding your song isn’t for them, sending negative signals to the algorithm.
| Mid-Campaign Adjustment | Rationale |
| Audit and Refine Audiences | Stop or heavily reduce budget on ad sets with the worst Save/Skip rates. They are harming your algorithmic performance. Pivot to narrower, more genre-specific audiences. |
| Test New Creative Assets | Your current ad creative might be misleading. If the song is Lo-Fi but your ad creative looks like Pop, you’re attracting the wrong crowd. Test a new visual that better represents the track’s sound. |
| Refine Ad Copy | Change the call-to-action (CTA) or ad copy to be more explicit about the song’s genre (e.g., “Mellow Indie Pop” vs. “New Music”). |
Scenario C: Low Streams, Low Saves ❌
The Feedback: Your advertising is not reaching enough people, or the people it is reaching aren’t your fans. The campaign is failing to gain traction.
| Mid-Campaign Adjustment | Rationale |
| Creative A/B Testing | Your cover art and ad creative are failing to capture attention. Immediately test 2-3 radically different visual concepts in your ads. A better thumbnail can drastically improve click-through-rate (CTR). |
| Budget Redistribution | Pause the current campaign. Rethink your primary platforms. Maybe your audience is on TikTok, not Facebook/Instagram. Reallocate spend to the platform where you have a higher chance of virality. |
🎯 The Long-Term Prize: Discovery Weekly
The immediate adjustments based on the first 24 hours of Release Radar and ad performance are all geared towards one major prize: Discovery Weekly.
DW is Spotify’s largest and most powerful algorithmic playlist, but it is notoriously hard to “crack.” The algorithm populates DW based on listeners who have demonstrated intent by saving a track or adding it to a playlist.
By ensuring your initial advertising drives high-intent listeners (Scenario A), you are successfully proving to Spotify that your music deserves to be pushed to millions of new, similar listeners via Discovery Weekly. A successful feedback loop in the first 24 hours sets the stage for exponential growth in the following weeks.


 🔥 Limited Time: Get 55% OFF All Plans - Ends in: